KEY INSIGHTS
The NPS® trends you need to know
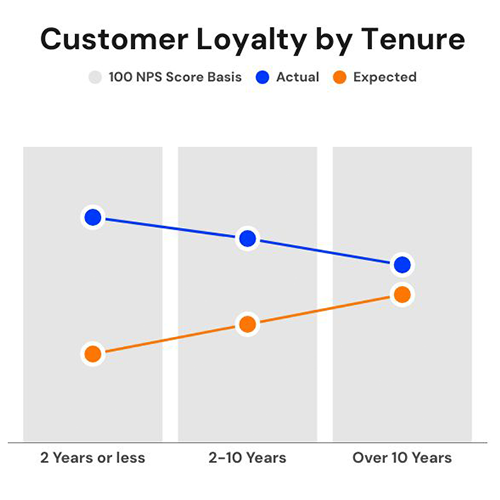
Two-year “honeymoon period”—Subscriber satisfaction declines over time
Subscriber ratings are highest in the first 2 years after installation. Over time, sentiment becomes more passive and ratings decline.
Key Insight: BXPs with focused loyalty initiatives to maintain the subscriber relationship over time are able to extend the honeymoon period and lessen the decline.

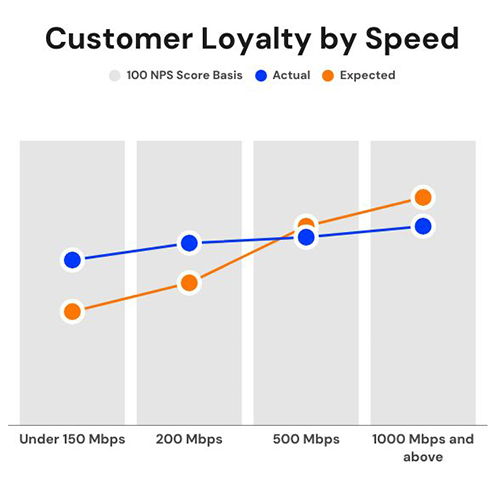
Internet speed is not a differentiator for subscriber experience once bandwidth exceeds 100Mbps
As more BXPs are crafting their entry level service tiers above 100Mbps, there is little differentiation in NPS by service tier. Subscribers on higher tiers are paying more, but do not typically have higher Net Promoter Scores.
Key Insight: Re-evaluate your offer strategy to differentiate more expensive tiers with additional services and/or higher levels of support.

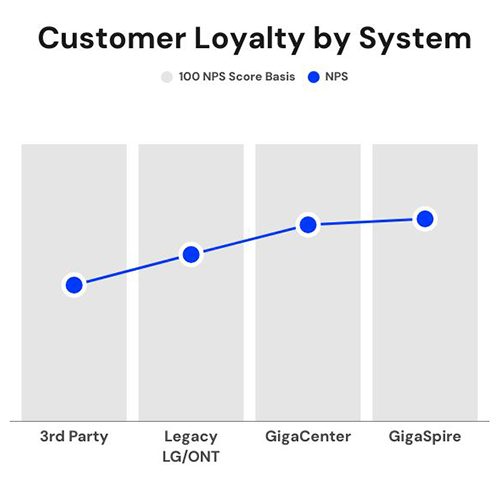
In-home technology matters
Subscribers with superior Wi-Fi technology have higher NPS than those with legacy or 3rd party systems. Scores increase even more with a mobile Wi-Fi app and advanced capabilities like network security and cellular backup.
Key Insight: A seamless, feature-rich, and user-controlled Wi-Fi experience, enabled by modern technology, a mobile app, and advanced services, is a key driver of higher customer satisfaction (NPS).

Marketing Matters
Earning customer loyalty after the honeymoon
Chelsi Runyan, Senior Manager of Calix Business Insights Success, and Scott Neuman, Corporate Vice President of Marketing at Calix, discuss how business insights help our customers create better subscriber experiences and even improve net promoter scores.
Subscriber Satisfaction
The pillars of higher subscriber satisfaction
Delivering all of the following services to subscribers makes all the difference.
250Mbps internet speeds achieve outstanding customer satisfaction and Net Promoter Scores (above 50 and exceeding industry standards), increasing speeds further does not proportionally raise NPS figures.
The latest Wi-Fi technology, through an advanced system, can lead to greater customer satisfaction compared to basic or third-party Wi-Fi. This typically results in loyalty scores that are at least 15% higher.
A mobile app combined with additional managed services can significantly boost customer loyalty, leading to excellent satisfaction ratings. Subscribers without access to such apps or managed services generally report lower satisfaction.
A personalized, convenient, and satisfaction-oriented customer experience drives loyalty. Exceptional customer service is reflected in higher sentiment scores and satisfaction, which rise above baseline scores.
Research into key drivers indicates that customer tenure is a significant factor. In the absence of a customer loyalty program, a sharp decline in customer loyalty can be observed between two to three years.
Network service reliability positively influences customer retention. Research indicates that a significant portion of customer retention variability can be attributed to the dependability of the internet service provided.
TOP 24 KPIs
Contribute to subscriber satisfaction
Successful broadband providers are embracing metrics and measurement.
- Financial / operations
- Customer experience
- Installation and repair
- Network management
- Sales and marketing

